Capillary Bundle Size Distribution

Contents
Once the building operation is complete it is possible to calculate the size distribution of capillaries seen in the virtual reality viewers. The first distribution of sizes you will see is the number distribution with two graphs showing pores and throats separately. The size distribution for the capillary bundle model, requires you to click on the advanced button and select the option "combine pores and throats" from the advanced menu. The graph will then display the number distribution, where the number of capillaries are counted and displayed relative to each other. The next figure displays the number distribution for the outcrop sandstone. The other point to raise about the size distribution shown below is that a number distribution expects a larger number of void features (capillaries) to create the required volume for the smaller void feature sizes. The outcrop sandstone sample is a simple structure and you will notice that there are a limited number of different pore sizes, experimental data containing more data points will have more feature sizes.
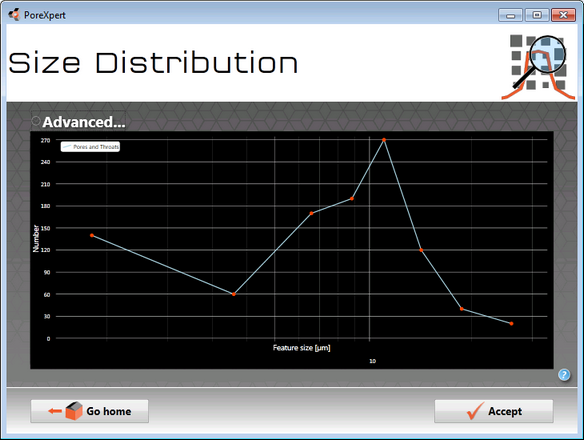
Capillary bundle size distribution by number of features.
The next figure shows the volume distribution for void features normalised to give a percentage. The distribution shown in the next figure is much more representative of the traditional interpretation method for mercury porosimetry curves, where you see the first derivative of the intrusion curve.
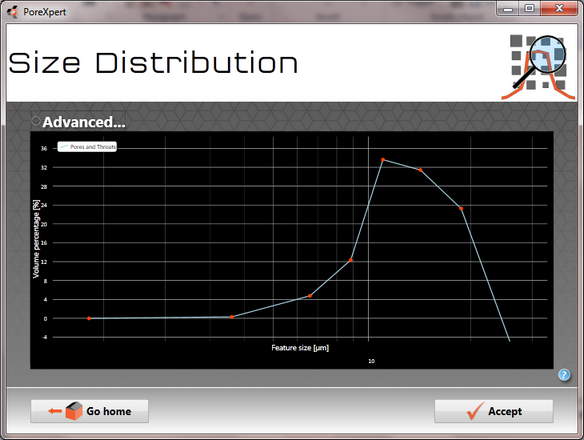
Normalised volume distribution against combined feature size for outcrop sandstone.