Connectivity Distribution

Contents
The connectivity distribution tutorial can be followed using any version of PoreXpert. In this part of the analysis tutorial, the fertiliser sample will be fitted using different structure types and the connectivity distributions will be exported as a spreadsheet so a normalised graph can be plotted to determine how structure type can affect the pore connectivity. The connectivity distribution screen for a capillary bundle will show a connectivity of 2.
The following figure shows the connectivity distribution screen for a 10 x 10 x 10 unit cell fitted using a random structure. The ink-bottle pores are highlighted in the figure below by a blue line indicating a connectivity of 1. Above the graph is an advanced menu which allows you to normalise the distribution, or view the distribution by volume.
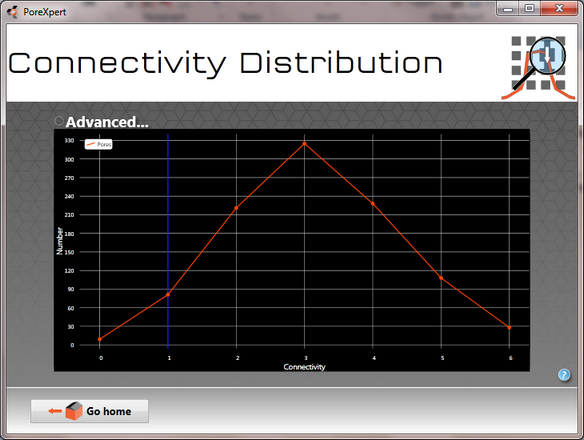
Connectivity distribution screen showing the connectivity of a fertiliser sample, the connectivity distribution is showing the number of pores with the appropriate number of connections.
Click on the accept button to return to the main screen. On the main screen save the operations list as a csv file, to view the data exported to a spreadsheet.