Connectivity Distribution

Contents
The connectivity distribution analysis operation is available in all versions of PoreXpert. The connectivity distribution analyses all of the pores within the unit cell and determines how many throats are connected to each individual pore. Above the graph is an advanced option which allows the connectivity distribution to be normalised or view the distribution by volume of features.
The connectivity distribution analysis operation provides a graphical representation of the connectivity distribution as shown later. The ink bottle pores are highlighted in the figure to indicate there importance in the hysteresis of mercury during a mercury porosimetry experiment.
The connectivity distribution works out whether a pore has:
| • | zero connectivity - an isolated pore |
| • | one connection - an ink bottle pore |
| • | two connections |
| • | three connections |
| • | four connections |
| • | five connections |
| • | six connections |
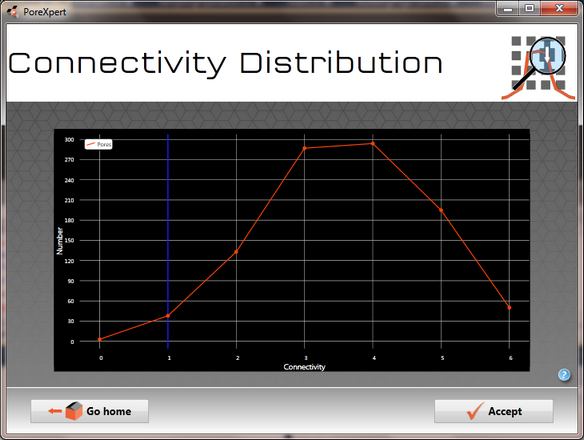
Figure showing connectivity distribution for outcrop sandstone with a 10 x 10 x 10 unit cell.