PDF Fitting Report

Contents
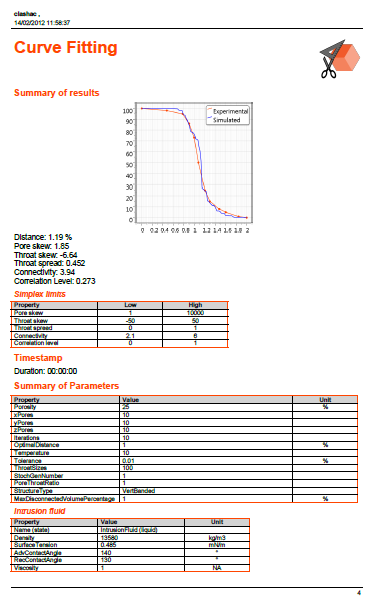
The PDF fitting report shown in the next figure summarises the fitting parameters and provides a visual comparison between the experimental and simulated at the top of the fitting page, underneath the graph you can find the parameters used to generate the simulated fit within the restraints of the default simplex limits or user defined simplex limits. The next two tables summarise the parameters used in the experiment and simulation, and the material properties of the percolating fluid.