Pore and Throat Size Distribution

Contents
The pore and throat size distribution algorithm is available in all versions of PoreXpert.
The pore and throat size distribution uses the unit cell characteristics to determine the pore and throat size distribution, and plots the relative frequency of each pore and throat graphically as shown in the next figure. The left hand graph shows the pore size and number of features at each size and the right hand graph shows the throat size distribution, with the number of throats at each size. The size distribution screen shown below currently displays the number of pores and throats at each size. The graphs shown in the next figure are not suitable for use with the capillary bundle model.
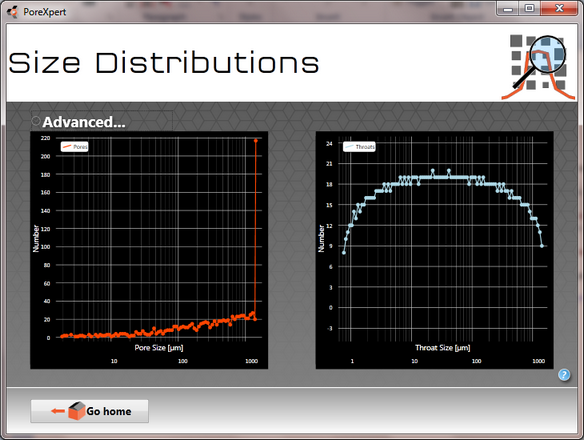
Size distribution screen operating in number mode with a separate graph for pores and throats.
Advanced Controls
Above the left hand graph there is an advanced drop down button which allows the user to change the type of pore and throat size distribution calculated from the unit cell. The options can be used individually or combined in any combination to change the graph displayed by the software.
| • | Normalise data - the normalise data option converts the y-axis on the pore and throat graphs to a percentage value for number or volume, the normalise option makes it easier to compare with results from other experimental techniques. |
| • | By volume - the by volume option uses the unit cell structure to determine the volume of all the pores and throats, and converts the y-axis scale to the volume in µm3, or if the normalise data option is chosen the y-axis changes to the percentage volume for each feature size. |
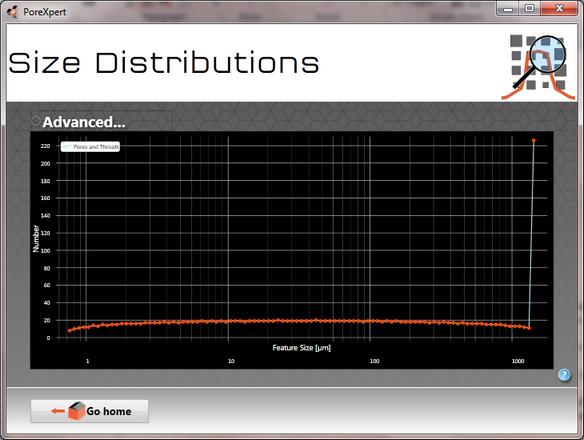
| • | Combine pores and throats - the combine pores and throats option combines the pore and throat size distribution graph to a combined feature distribution graph, on the x-axis. With the y-axis displaying either number of features, percentage number, volume of features or percentage volume. The combined feature distribution graph is shown in the next figure with a number distribution on the y-axis. |