Tortuosity

Contents
The tortuosity is defined as the tortuous path taken by an ion through the unit cell, compared with the length of the direct path through the unit cell, i.e. the unit cell size in the z-axis. We recommend that the tortuosity is run in batch mode as the algorithm runs slightly quicker in batch mode, and it allows you to use some other operations while the tortuosity calculation is being performed.
The algorithm outputs a histogram of the paths taken through the cell and the median value which we define as the tortuosity. The next figure shows the tortuosity output for a 10 x 10 x 10 unit cell.
Once the tortuosity algorithm completes it will return to the home screen, and in the operation list the median tortuosity value will be stated. If you double click on the completed operation, the tortuosity graph will be displayed as shown below.
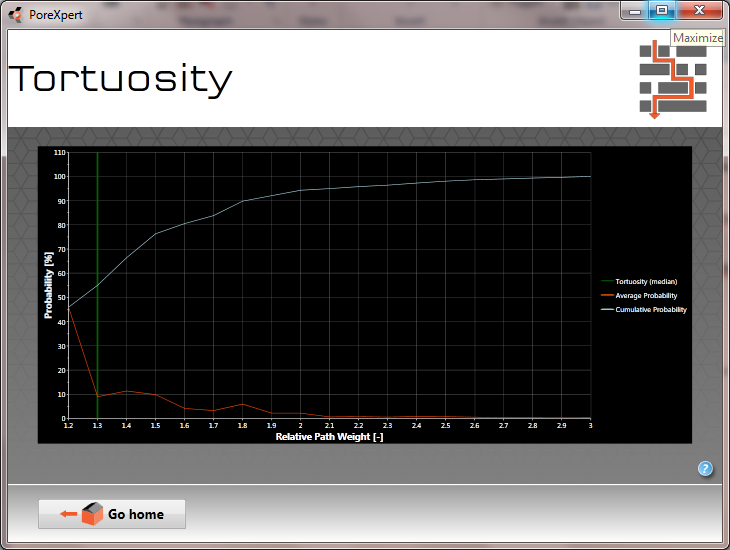
Tortuosity output for a 10 x 10 x 10 unit cell representation of pore glass
The y-axis displays the probability of the relative path length. Note that the x-axis starts at 1.2. This is the shortest path length discovered by the algorithm, so below this value, the probabilities of paths are not defined. At the first value, in this case a 46% probability of a path length of 1.2, both the Average Probability (i.e. the probability of that particular path length) and the Cumulative Probability (i.e. the probability of all paths of 1.2 or shorter) are the same. The single-valued tortuosity is taken to be the median path length. This is a more stable statistic than the mathematical average, because it is less affected by extreme high values of the distribution, even when these values have low probability.
Note:
This operation may take a very long time to complete, depending on your hardware capabilities and the unit cell size. For a 20 x 20 x 20 unit cell the tortuosity algorithm can take more than 4 hours to complete.