Void size range
In order for PoreXpert to model percolation measurements, the pressure or suction (tension) range over which measurements are made is converted to a range of throat-entry sizes using the Laplace equation (as shown previously for mercury porosimetry and water retention). PoreXpert takes the resulting range literally - i.e. the void structure model you generate will include voids covering the entire size range. That would be fine for an infinitely flexible model - but PoreXpert is not infinitely flexible. Above all, to make the maths tractable, the voids are arranged on a grid which is equally spaced in each of the three Cartesian directions. So if your percolation data suggests a few very large voids, the entire grid of voids will be spaced out to at least the size of the largest void so that none overlap. Small pores, connected by small throats, will be spaced equally far apart, even though in natural porous samples, small voids tend to be packed closer together than large ones. So you need to think hard about whether you wish to model the lowest pressure (largest size) intrusion.
You also need to think about the highest pressure / smallest size intrusion. Are there many points close to 100% intrusion? - in which case, truncate the datafile. Or for some samples, such as Gilsocarbon graphite and tight oil shale, many of the interesting pore fluid effects occur at sizes smaller than accessible by mercury at the highest pressure of a commercial porosimeter - i.e. smaller than 4nm. Under those circumstances you should consider extending the effective percolation characterise by supplementing the mercury intrusion curve with another experimental technique, such as adsorption.
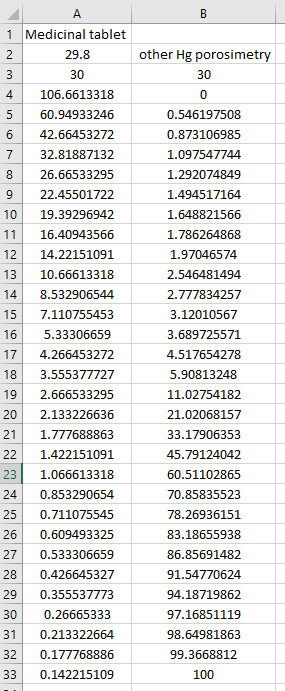
Let us take as an example the Medicinal Tablet.csv data file, loaded into the directory created at install time ..\PoreXpert\Example Files\Experimental Data\Porosimetry (which derives from our work published in Ridgway et al. 1997) . It is in PoreXpert format. Download the free package PoreXY via the Registration Page of the PoreXpert website. Load the datafile. PoreXY calculates the bulk modulus of compressible samples, but requires more information than is stored in this format. So you will receive the following message:
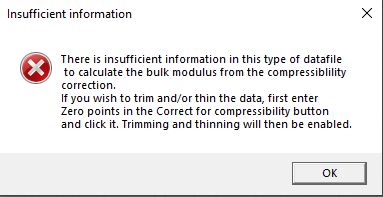
Click the OK button next to the message, enter the number zero in the box in the Correct for Compressibility button, and click that button. The software will then plot the intrusion curve as shown:
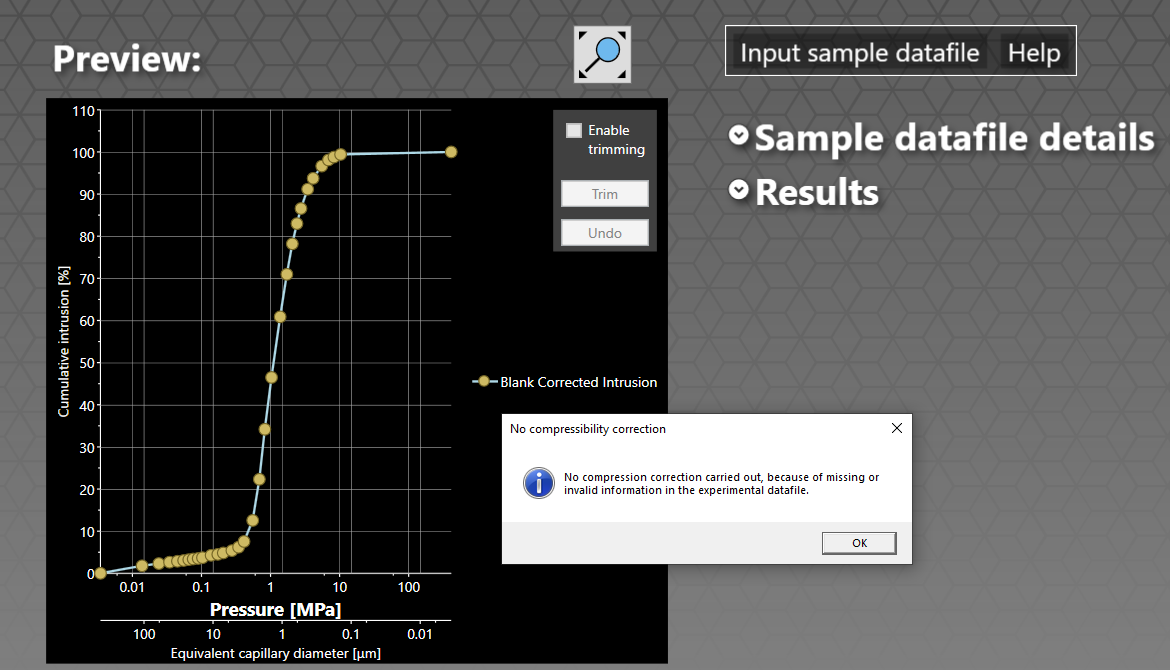
It also displays a message to state that no compressibility correction has been carried out. There is also no correction for a blank file.
Now look at the curve. PoreXpert plots the data you enter literally, so we have to ask whether we wish to model the 1.79% of intrusion from 427 μm to 107 μm, remembering that the largest size will space out all the voids, including the smallest ones. For this exercise, our answer is no - so we ditch that one. Also, at Laplace size below 0.14 μm the intrusion only rises from 99.4 to 100%, and it is not worth burdening the model with having to model the smallest voids. That small amount of intrusion may actually be because the tablet is compressible. So enable truncation, and drag the truncating lines by placing the mouse pointer in the data boxes at the tops of them. You should then have a graph screen that looks like this:
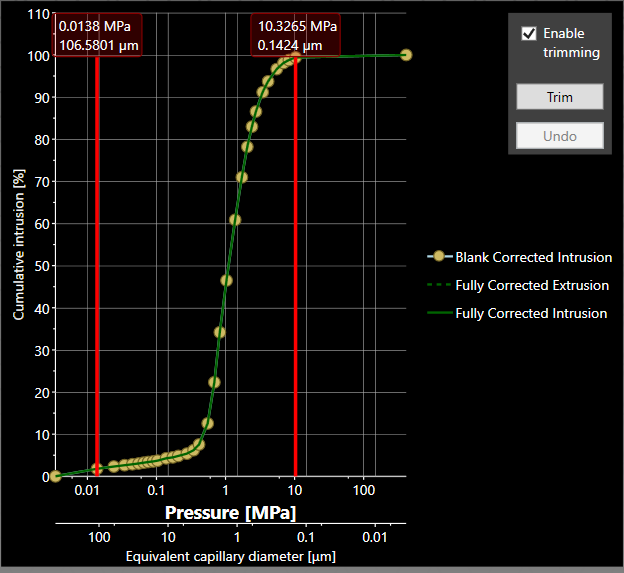
Click the Trim button to apply the trimming. The porosity of the sample reduces proportionally from 30.0% to 29.6%, as can be seen in the Results dropdown menu.
For the current sample, any compression effects can be ignored, and the intrusion curve truncated back to 0.14 μm. So, truncate the Medicinal Tablet.csv file to the range specified, and re-scale the truncated data to 0 to 100 %, as shown:
If you are studying a series of samples, then to avoid size-range artefacts you need to either (i) truncate each sample to the same size range, or (ii) shift the size range according, for example, to the position of the point of inflexion of the intrusion curve. An example of the case (i) would be if you are studying a series of outcrop sandstones occluded to a different extent, or a series of samples of building stone weathered to a different extent. Examples of case (ii) are sintered metal filters where the green samples have been compressed to different extents before sintering, or a range of different geological samples, as exemplified by our validation study.
We are now ready to consider the next topic - spacing of data.