The content distribution algorithm tutorial uses the granite data file with large pores spherically arranged in the centre of the structure. By following the Wetting Fluid Uptake tutorial, wet the sample for 500 ms with water.
Then click on Run new operation ... | Analysis... | Content Distribution.
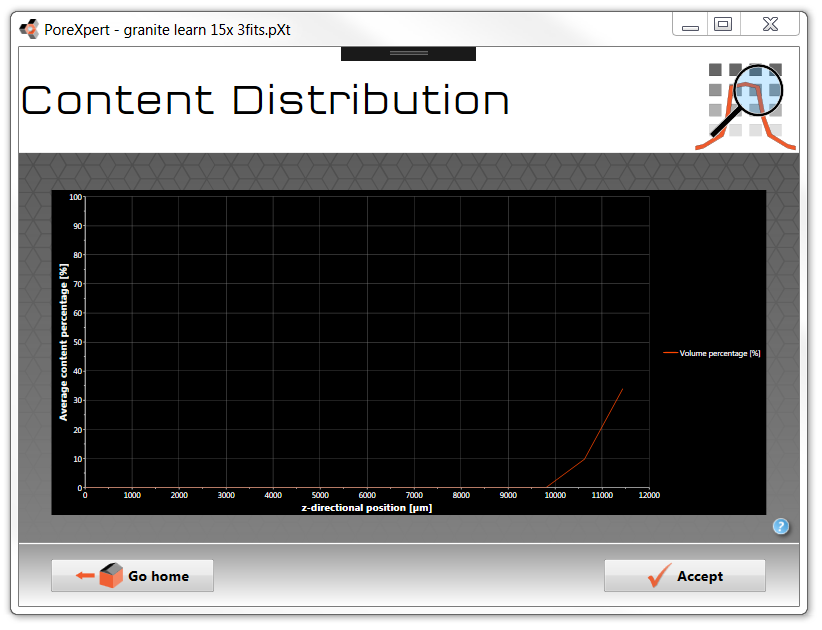
The following screen shot shows the resulting graph. The content is shown with respect to the z axis (remembering that all fluids are applied at maximum z, and tend to travel in the -z direction), then obtain a connectivity distribution graph. So it confirms, as can be seen in the Wetting Fluid Uptake tutorial that only the top (maximum z) region of the granite unit cell has been wetted after 500 ms.