The simplex aims to minimise the Distance between the percolation characteristics of the simulation and the experimental sample. It does this by moving around like an amoeba in five-dimensional parameter space. The throat size distribution is controlled by two parameters - throat skew and throat spread - that alter the shape of log/Euler beta distribution, which encompass Poisson-like and Gaussian-like and bimodal distributions (Price et al, 2009).
The simplex curve fitting screen is shown in the next figure and there is a brief description below the figure which explains the basic controls of the fitting screen. The advanced controls are explained in the main text that follows.
If you are working in Batch mode multiple fitting operations can be performed simultaneously if your computer has more than one core available for use.

PoreXpert simplex fitting screen, showing the experimental data as percentage intrusion plotted against equivalent capillary diameter in microns. The equivalent capillary diameter is calculated using the experimental properties read from the data file such as the mercury contact angle for mercury porosimetry and air contact angle for porometry data, using the Laplace equation.
The figure shows three menus on the right-hand side of the screen. The first menu is labelled Structure; this allows you to choose from one of eight different structure types. Each of the structure types has a small graphical representation of a structure. For more details about the structure types please follow the links. The structure types you can choose from are:
• |
Random - Cuboidal unit cells are restricted to this type of structure. |
• |
Capillary Bundle Model - If you use a capillary bundle model, the subsequent operations that can be performed are limited. |
Cell properties
The Cell properties dropdown menu allows adjustment of the unit cell size, and manual adjustment of the cluster ratio. The cluster ratio will not alter the fit - only the unit cell graphics and the void size distribution. The usual approach is to leave the cluster ratio at zero while carrying out the initial fits, and then use the Auto cluster ratio facility to find the cluster ratio of the best fit.
The slider allows adjustment of the unit cell size from 5 pores along each edge to 30 pores along each edge. The corresponding maximum number of void features, i.e. both pores and throats if connectivity is 6.0, is displayed above the slider. Our usual unit cell size is 25x25x25, because above that the permeability calculations are beyond the capabilities of our computers at the time of writing. Smaller unit cells give rise to faster calculation times, so are useful for trying out different structure types initially. However, the smaller the unit cell, the greater its level of repetition necessary to model your sample, and the less valid it becomes, in particular unit cells smaller than 15x15x15 are likely to give anomalous results when using the auto cluster option, and when simulating other properties.
Manual dimensions
These controls allow for rectangular cuboidal unit cells (rectangular parallelepipeds) . However, only use cuboidal cells if you have to, for example for a very thin porous coating, as the functionality can be reduced. Such shapes may be restricted by the sub-version licence.
![]() Fitting may take a very long time to complete, depending on your hardware capabilities and the unit cell size.
Fitting may take a very long time to complete, depending on your hardware capabilities and the unit cell size.
Advanced Fitting Parameters
The Advanced... menu allows parameters which affect how the simplex fits the data to be manipulated. The list below details what changing each of the parameters will do to the simplex.
The simplex parameters directly affect the operation of the simplex by increasing the time to perform the simplex or by changing the sensitivity of the simplex.
• |
Enable learning mode - enables your software to learn by experience, in terms of the simplex starting parameters. By default, keep this option switched on. Note that if you crash out of PoreXpert, rather than exiting cleanly, then you will lose any experience gained in that session. See also moving between computers. |
• |
Optimal distance - this is the distance below which the simplex will automatically stop. The default parameter is 1, increasing this value can compromise the accuracy of the fit. |
• |
Tolerance - The tolerance is a value that checks the distance calculation from iteration to iteration, if the change in distance is less than this value the simplex will stop. We recommend a value of 0.01. Changing this value will increase and decrease the sensitivity of the simplex. |
• |
Iterations - the iterations' parameter dictates how many iterations are performed at each annealing temperature. By increasing the number of iterations the time taken for the simplex to complete is increased proportionally to the number of iterations performed. Increasing the number of iterations increases the sensitivity of the simplex we recommend increasing the number if the simplex is finding it difficult to model your experimental data. |
• |
Convergence Factor - This is the starting convergence factor for the annealing simplex and as the annealing simplex runs it halves this number as the appropriate number of iterations is performed at each convergence factor. The minimum convergence factor used with the annealing simplex is 0. By increasing the convergence factor you are providing more energy to the simplex so the simplex can move around more in parameter space. |
• |
Stochastic generation number - The stochastic generation number tells the software to use a different set of pseudo random numbers to generate a structure for the experimental data. This parameter allows statistical analysis to be performed on the simplex limits to select the most appropriate fit of the experimental data. Use of different stochastic generations is particularly important for modelling secondary properties such as permeability, as demonstrated in our properties validation. |
Simplex limits
We do not recommend changing the simplex limits as this constrains the range of parameters the simplex can work with and can compromise the simplex. There are occasions when it is beneficial to change the parameters and these are explained below:
• |
Pore skew - The pore skew has a range from 1 to 10000. Pore-skew is a parameter which bulks up the pores to obtain the correct porosity. The usual reason that PoreXpert cannot achieve the right porosity is that all its features are packed together at an equal spacing in the three Cartesian co-ordinates, whereas in a real sample, small voids are usually closer together than large ones. So the pore skew parameter is a means of overcoming this inadequacy. Bulking up the pores does not greatly affect the percolation properties of the network, nor does it greatly affect the permeability, as both of these properties are mainly governed by the small throats, not the large pores. However, it does make the inter-pore space small, and therefore generates anomalously small representative particles or skeletal elements. |
• |
Throat skew - The throat skew controls the throat-size distribution in collaboration with the throat spread. Throat skew forces the distribution more to smaller sizes if negative, and larger sizes if positive. |
• |
Throat spread - the throat spread increases the throat size distribution so is directly affected by the experimental data range and it can be recommended to trim regions of the experimental data curve if there are large regions with no intrusion. |
• |
Connectivity - The range for the connectivity can change from 2.1 - 6. The value for the connectivity dictates the average number of throats that connect with all the pores in the structure. |
• |
Correlation level - The correlation level can change from 0 (no correlation) - 1 (full correlation), by changing the correlation level limit you are restricting the correlation levels that the simplex can use. This is only recommended if you have performed several stochastic realisations without constraining the simplex, and you are generating a fit around a common range of variables excluding outliers. The other time the correlation level should be restricted is when you want to see how the correlation level affects the permeability for different structure types. |
Enter the surface-accessible porosity of your sample - not the total porosity. So for mercury porosimetry, use helium pycnometry to find the helium-accessible porosity, and do not include closed porosity. For soil, enter the porosity available to mobile water - do not include the immobile water which under ambient conditions resides in e.g. the clay matrix. For porometry, use helium pycnometry and/or imbibition.
Distance
The simplex aims to minimise the Distance between the simulation and experimental data points. Distance is defined as shown below. Each axis is scaled to 100% (the horizontal size axis is logarithmic). Then the distance is measured between each experimental point (shown as a red dot) to the nearest simulated point, shown as blue dots in the enlargement, but not shown on the PoreXpert graph. Then the distance (shown as a pink line in the detail) is measured as a percentage, by Pythagoras' theorem. Finally, all the distances are averaged, to give the overall distance. In the figure below, the Distance is 0.78 %, which is well below 1%, so the fit is very successful. Distances above 1% are increasingly mediocre, and above 2% are invalid.
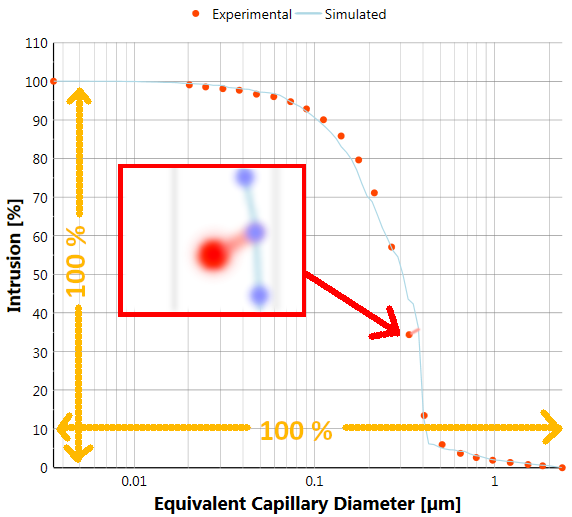
Explanation of the Distance parameters used to measure the quality of the fit of the simulated to experimental percolation characteristic. Distance shown is 0.78% (very good), for a fit of a vertically banded structure to a paper coating formulation (Clay Paper Coating with Latex.csv in your Examples directory)
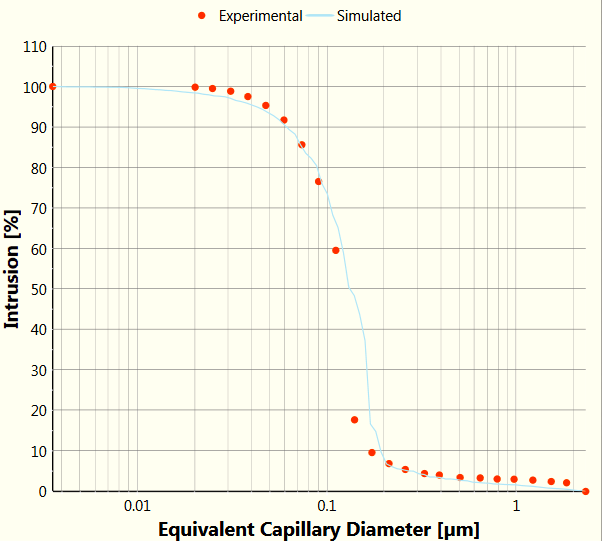
A less valid fit to the sample (Distance 1.25%)
Note that if experimental points are bunched with respect to their position on the logarithmic pressure / size axis, that portion of the curve will receive undue weighting in the fit. So we recommend your thin your data before modelling it. An example of why such thinning is necessary is shown in the void size and permeability validation.