There have been many previous multi-technique investigations of pore structure and pore architecture. A previous comparison of porosimetry and porometry showed that the latter is skewed towards smaller pores (Calvo et al., 1995; Li et al., 2006), as confirmed below, and Rigby (Rigby and Daut, 2002; Rigby et al., 2002a) has also carried out comparisons. However, multiple techniques are usually combined to give structures over a wider range of void sizes, rather than being critically compared. For example, mercury porosimetry and nitrogen sorption have been used to measure macroscopic (> 10 µm) and microscopic (< 10 µm) voids separately (Rigby, 2000), and SEM and nitrogen adsorption have been used in the study of SiO2 thin films (Sel et al., 2007). Rocks (Tsakiroglou et al., 2009) and soils have also been similarly studied, with the structure expressed as primary pores and throats, and a secondary fractal pore system. A recent work by (Mourhatch et al., 2011) uses flow permporometry to determine the pore size distribution of silicon carbides using two methods- the first method uses the Laplace equation with two key assumptions, that the pores are cylindrical and that the pores are not intersecting. They then proposed a pore network model based on invasion percolation to correct the pore size distribution determined using the Laplace equation.
Fundamental comparison of Porosimetry and Porometry
Using the Laplace equation, mentioned previously, it is possible to calculate the size of a cylindrical pore-throat (‘throat’) intruded by a non-wetting fluid applied at a pressure P relative to the evacuated void space within a sample:
[1]
Mercury intrusion measures the volume V of mercury intruded at a pressure P, corresponding to a throat diameter d. Mercury typically has a mercury / solid / vacuum contact angle θ of between 130 – 140° and interfacial tension γ of 0.48 N m-1 (van Brakel et al., 1981).

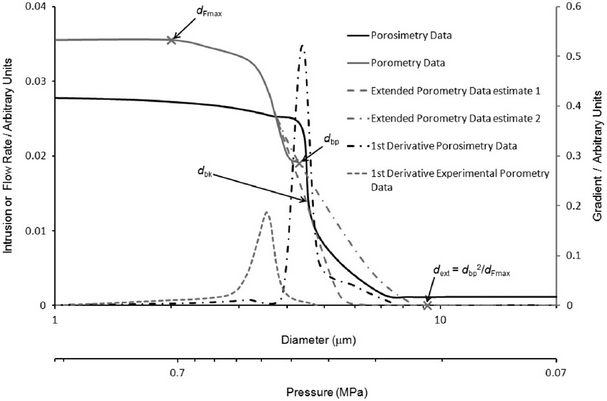
Figure 1. Schematic graph showing how extrapolated porometry data should compare with mercury intrusion data, and how mercury porosimetry and porometry data are interpreted using the capillary bundle model.
A common approximation is to assume that the void space comprises a bundle of aligned capillary tubes. An improvement on this approximation is to use a pore network model. Suppose for purposes of illustration that there are n1 such tubes of diameter d1 and length l1, n2 of diameter d2 and length l2 , and n3 of diameter d3 and length l3, where d1 > d2 > d3. We assume that d1, d2 and d3 are logarithmically distributed, i.e. that d1 / d2 = d2 / d3 , as typically found for natural samples. Suppose that there is a constant relationship between the diameters d of each feature and their lengths l, such that l = s dm, where s and m are assumed constant for all features. Suppose mercury at a pressure P2 is applied, where . Then a volume of mercury will intrude all the tubes of diameter d1 and d2, where by simple geometry:
[2]
Analogously, if there is an increase to a pressure , such that features of size d3 are intruded, then
![]()
[3]
For any applied pressure, PN, noting that the distribution of the N sizes is discrete rather than continuous

[4]
Almost universally in the literature, the first derivative of the porosimetry intrusion curve is calculated, as shown schematically in the Figure above, which we will refer to simply as the gradient. However, remembering that di is logarithmically distributed, from Eq. 3:
![]()
[5]
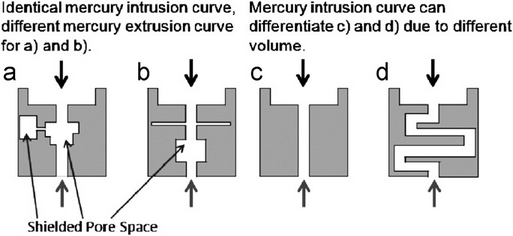
i.e. not that only, as is almost universally assumed in the literature. The persistence of the wrong assumption is based on the partial, but unquantified, cancellation of two implicit approximations – namely, this assumption of number rather than volume, which over-estimates the numbers of voids of larger sizes, and the ignoring of shielded pore space, which under-estimates voids of larger sizes. Shielded pore space is that for which the only access is via a throat of smaller diameter, Figure 2 a) and b) below.

Figure 2. Comparison of how mercury porosimetry and porometry probe the pore architecture of schematic structures with simple quaternary level pore architecture. Mercury for standard porosimetry is applied in the direction of the upper and lower arrows, and for shielded mercury porosimetry in the direction of the lower arrows only. Air, for porometry, is applied in the direction of the upper arrows. Porometry would not be able to differentiate between the four different structures.
When carrying out mercury porosimetry, the breakthrough of mercury from one side of the sample to the other occurs close to the point of inflection of the mercury intrusion curve at a breakthrough pressure Pbk, equivalent to a breakthrough diameter dbk via Eq. 1. As illustrated in the schematic graph, the volume intruded at Pbk (diameter dbk) is generally around 50 % of the total intrusion volume.
Porometry also uses Eq. 1. with a contact angle of 180° for air against a wetting liquid, and the assumption that the gradient, as defined above, gives the relative number of features of a certain size d. However, in the case of porometry, measurement does not start until the bubble point pressure, corresponding to a size dbp via Eq. 1, at which gas first breaks through the sample. At this point, gas has already displaced fluid from all features larger and upstream of those controlling the breakthrough flow path through the sample. The porometry bubble point (Pbp , dbp) therefore corresponds to the breakthrough point (Pbk , dbk) in mercury intrusion. Consequently, the characteristic porometry curve covers only void sizes smaller than dbp, and its traditional interpretation exaggerates the number of smaller void sizes relative to porosimetry. Once the bubble point has been reached, air flows through the sample in a totally different way from mercury. Assuming that the flow is laminar, it will obey Poiseuille’s equation, such that the volumetric flow rate Q of the gas is
![]()
[6]
where ΔP is the pressure differential across the sample, equated to P in Eq. 1, and η is the kinetic viscosity of the gas. Roughness will affect the validity of Poiseuille's relationship in Eq. 6, as will constrictions and other deviations from a cylindrical geometry. By analogy with Eq. 2 assuming a parallel pore model,

[7]
In porometry, the absolute flow Q at a particular differential pressure, rather than the gradient differential of the intrusion curve as in porosimetry, is used to find the void size distribution, and almost universally it is assumed that m = 2 in Eq. 7. However, equating the proportionalities in Eqs. 5 and 7, m = 3/2 is the one condition whereby porosimetry and porometry deliver the same proportional distribution.
Shielded pore space is largely ignored by porometry, in the above figure. For filtration purposes, this shielded pore space will add to the holding capacity but not greatly affect the filtration size characteristics. So, porometry is valid for the measurement of filtration characteristics.
Figure 2 a) and b) above show cross-sections of structures with different pore geometries, but with the same initial mercury intrusion (percolation or drainage) characteristics because there is initially an identical size / volume progression from large to smaller void features within the void network. However, mercury extrusion (imbibition) would detect the difference between the networks if the single entry (‘ink bottle’) pore to the left in Figure 2 a) is much larger (typically more than five times larger) than its entry throat so that snap-off occurs (Dawe and Egbogah, 1978). Structures c) and d) have the same diameter throat with different volumes and tortuosities. In theory, mercury porosimetry should be able to detect the difference between these structures, because for structure d) there would be greater volume of piston flow down the throat once the required pressure was reached according to Eq. 1. In real samples, however, differences of this type are more subtle and difficult to detect.
The application of porometry to the samples in the comparison schematic would involve initial application of a proprietary wetting fluid in the direction of either the upper or lower arrows, which is then held in the structures by capillarity. Air, subsequently applied in the direction of either the upper or lower arrows, would break through all the structures at the same pressure, so would be unable to differentiate between them. The flow rates through the dry structures, largely controlled by the smallest throats within critical flow pathways, would also be identical. So, porometry would suggest a distribution of smaller voids than porosimetry, as found for real samples (Calvo et al., 1995; Li et al., 2006).
If in shielded porosimetry the tops of the schematic samples were resin embedded, mercury will intrude in the direction of the lower arrows only, in the figure above. So, it would mimic porometry and be unable to differentiate between the four structures. However, the fact that the results of standard porosimetry, and those of porometry or shielded porosimetry, were different, would identify that the structures had a quaternary level of pore architecture – in this case that they had one face with large pores, and one with small.
A quantitative comparison between porometry and porosimetry can be made by using the PoreXpert model. In order to derive directly comparable void structures from the two techniques, we assume that the porometry curve commences at 50 % of the intruded volume by analogy with the mercury porosimetry curve. We also specify one point dext on the extended porometry asymptote at low pressure / large size, the same distance above the bubble point dbp on the logarithmic axis as the high pressure / small size asymptote dFmax is below it, as shown in the graph above, so that:
![]()
[8]
The result is that we have extended the porometry curve so that it is equivalent to a porosimetry curve. However, there are no experimental points between dbp and dext for the model to fit. Therefore, the model is free to simulate any percolation characteristic between those two points, and so there can be wide variations between different stochastic realisations of the model, illustrated as estimates 1 and 2 in Figure 1 above. This is a direct consequence of porometry omitting much of the larger detail of the pore structure. The stochastic variation could be reduced by comparing the simulated permeability of different stochastic realisations with the permeability measured by the porometer during its dry runs, although variations in permeability are more sensitive to void sizes below the breakthrough diameter than above.