A major problem with PoreXpert versions before version 2 was that the void size distributions looked unrealistic, and had a discontinuity at maximum size. This was identified as being due to the existence of void clusters, as explained on the Auto Cluster Ratio page. You should use the Auto Cluster Ratio facility before outputting pore and throat size distributions, so please read that page and read our publication cited there before continuing. Pore and throat size distributions without the correct cluster ratio are invalid.
The void size distribution graph is as shown below. A very important feature is that the Total Voids graph asymptotes top right to the sample porosity, thus validating the calculation.
If you want to zoom in on a section of the graph, drag over the area using the left hand key on your mouse. To return to the full graph, click the right-hand button on your mouse.
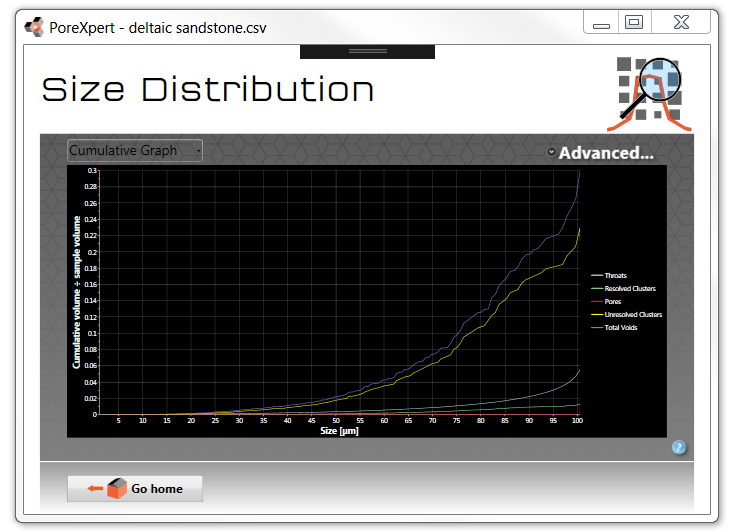
The Advanced... dropdown menu at the top right-hand side of the graph allows axes to be plotted logarithmically, and data points to be shown. As voids sizes within natural samples tend to be distributed logarithmically, then usually within PoreXpert the sizes are histogrammed to 500 intervals logarithmically spaced between the smallest and largest void size within the model, which in turn are set by the highest and lowest experimental intrusion pressure respectively. However, for narrow size ranges, such as those resulting from porometry, a linear axis is displayed in the graph within the Sampling and Fitting Results opening screens.
The top left-hand dropdown menu allows the user to change the type of pore and throat size distribution calculated from the unit cell. They are:
•Cumulative graph: the cumulative volume adding in successive estimates as size increases. The asymptote of the Total Voids line, at the top right of the graph, is therefore the porosity of the sample.
•Discrete graph: the individual estimate of the volume of features at each size, which when successively added together give the cumulative volume.
•Volume histogram: the total volume of all features at each size on the histogram, only categorized as pores, clusters and throats, without any estimate of the sizes of the voids within individual clusters.
To plot the graphs yourself, click the Go home button, then File | Save as... | PoreXpert file (to save for future modelling sessions), and then File | Save as... | CSV file to output the data in a series of comma separated variable format files, namely a summary datafile and a datafile for each of the operations carried out.