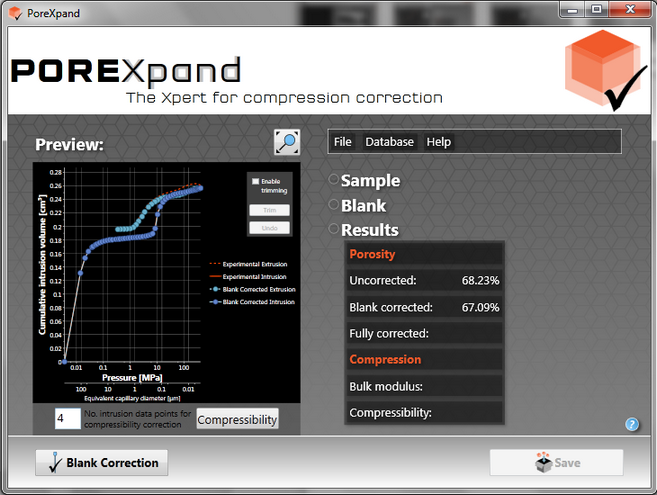
In the previous part of the tutorial the graph showed that the fourth data point was the correct point at which to correct for compressibility. Enter the number 4 into the box just below the graph, as shown in the next screenshot.

PoreXpand home screen before the compression correction has been carried out, with the number of data points text box filled in
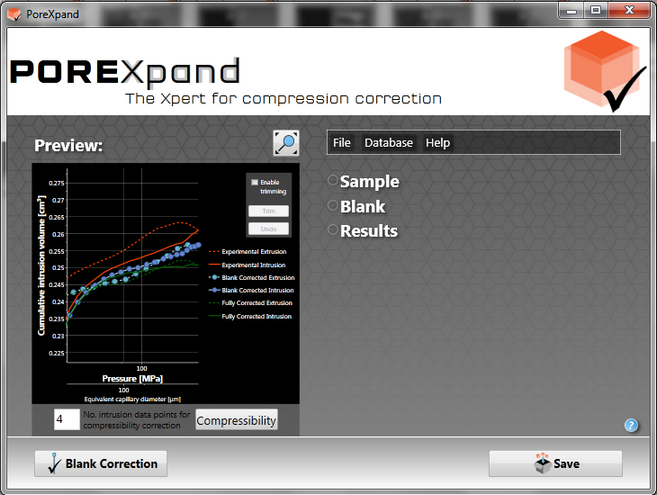
The next step is to press the Compressibility button, which will add a third, green curve to the graph. The aim of this curve is to bring the gradient at high pressure for the corrected green intrusion curve as close to zero as possible - i.e. as near horizontal as can be achieved, s shown in the next screenshot. For you own samples choose an appropriate number to achieve this - you will probably have to find the correct number by trial and error.

PoreXpand home screen showing three curves relating to the tutorial sample, the raw data in red, the blank corrected data in blue and the fully corrected curves in green
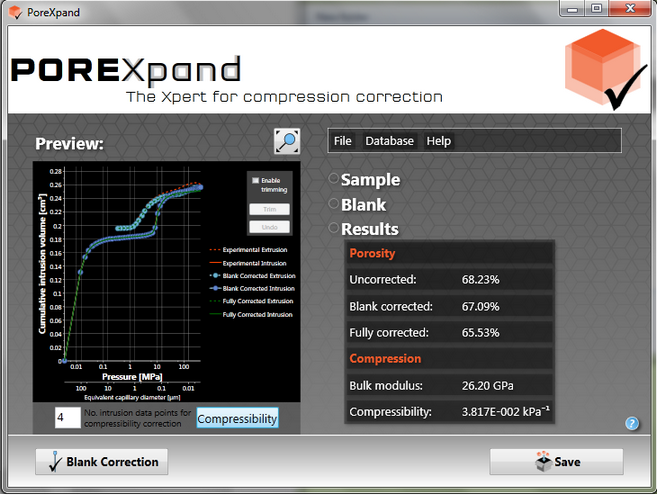
The Results dropdown menu on the home page is now fully populated with the physical characteristics calculated by PoreComp during the blank and compression correction of the experimental data.

PoreXpand home screen showing the results from the compression correction
The figure above shows three different values of porosity for the tutorial sample, and shows why it is important to correct for the compressibility as the compression of the sample affects the porosity by 1.6 %, which is an overestimate of the porosity by 2.4 %. When comparing the measured porosity with the completely corrected compressibility it is a difference of 3 %.
The Compression section of the Results drop-down list provides a value of Bulk Modulus of 26.20 GPa and a compressibility of 0.03817 kPa-1. Note that this is the compressibility characteristic of the solid phase of the sample - not the porous sample as a whole. An example of the usefulness of this measure is in determining the structure of paper coatings comprising kaolin clay whitener mixed with latex binder. If the latex binder is between the individual kaolin particles, the solid phase is much more compressible than if the kaolin particles form a contiguous matrix with binder simply gluing that matrix to the fibre substrate.
The next stage of the tutorial shows how you can use the trimming function to remove possible edge effects, or a plateau at high pressure.