The previous part of the tutorial finished the compression correction of the tutorial sample; this part of the tutorial will show you how to use the trim function to remove a possible edge effect in the low pressure range of the data. The trimming tool can only be used once the compression correction has been done, as it does not make sense to trim the data before correcting for compressibility.
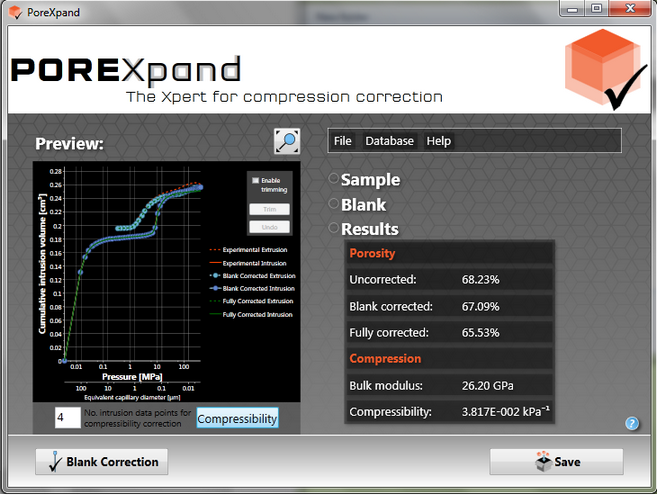
If you are still zoomed in to the top part of the curve, click on the Zoom out icon at the top of the graph to reveal the entire curves, as shown below.

PoreXpand results from the compression correction tutorial
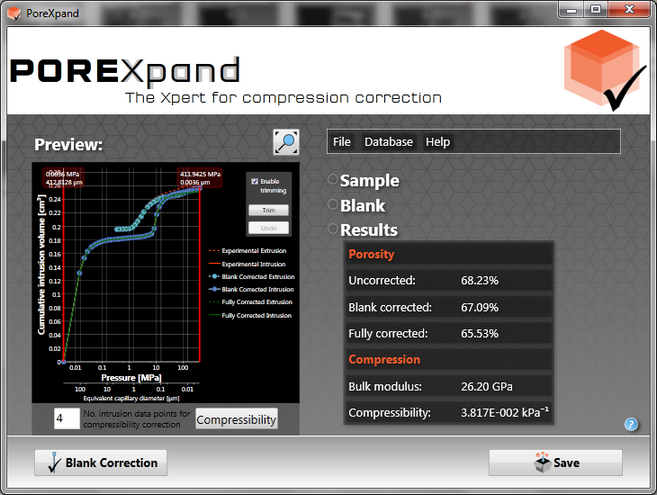
Click in the Enable trimming option at the top of the graph. Once it is enabled, the graph will show a slider on the left and right hand side of the graph, as shown in the next figure with the red lines. In the box at the top of the red line is the currently selected pressure and equivalent capillary diameter calculated using the properties of mercury from the sample data. Trimming the data does not change the original data file, - it merely reduces the range of pores and throats that PoreXpert needs to model. The porosity also changes on trimming; this is the porosity which you have chosen to be modelled, which may or may not be the true porosity of the sample.

PoreXpand home screen with the trim feature active
The trim feature will only trim where there is an experimental data point. To move the trim line, left click on the on the red line, and drag the line sudeways. In this example we are going to trim the low pressure side (left hand side of the graph) close to 0.1 MPa, and look to see how this affects the Results shown on the right hand side of the graph.
Drag the left-hand line and its box until the box displays 0.0894 MPa and 16.6233 µm.
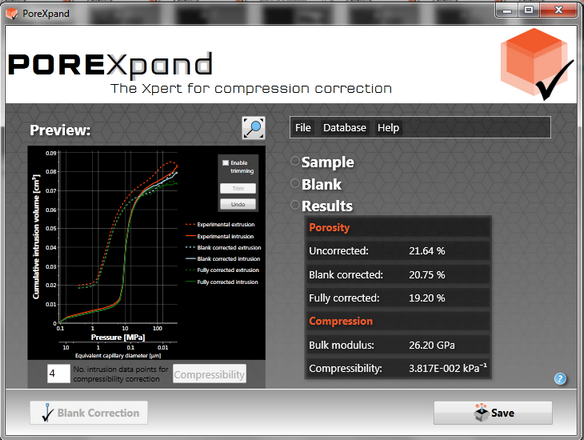
Click on the Trim button. (If you make a mistake you can click on the Undo button and it will reset the data to the full pressure range.) The next figure shows the trimmed graph with the updated results.

PoreXpand home screen after the tutorial data has been trimmed
The trimming of the data at close to 0.1 MPa makes a large difference to the porosity values. By trimming the data, you are indicating that you only wish PoreXpert to model the intrusion above 0.09 MPa (16.6 µm) - probably because you think that below this pressure the intrusion is between particles (inter-particle), or into void features near or at the surface of the sample, whereas you wish to model the void features within individual particles (intra-particle) or in the bulk of the sample. It can also be easier to find a fit to the data once it has been trimmed, but this should not be the reason for trimming it.
The next stage of the tutorial is exporting the data to PoreXpert and saving data.