The spacing of input data is another thing that PoreXpert takes literally. The goodness of fit, or Distance, is measured averaging the distance from each experimental percolation point to the nearest simulation point. So if your datafile has a large number of points in a particular region, it will assume that you think that region is most important. However, as commercial instruments tend to work from a table of equally spaced pressure, suction or tension values, there are usually fewer points along the point of inflexion part of the percolation curve rather than in other regions. Some commercial porosimeters can give out a very large number of data points, but there is no advantage to PoreXpert beyond having a hundred or so spaced appropriately along the intrusion curve.
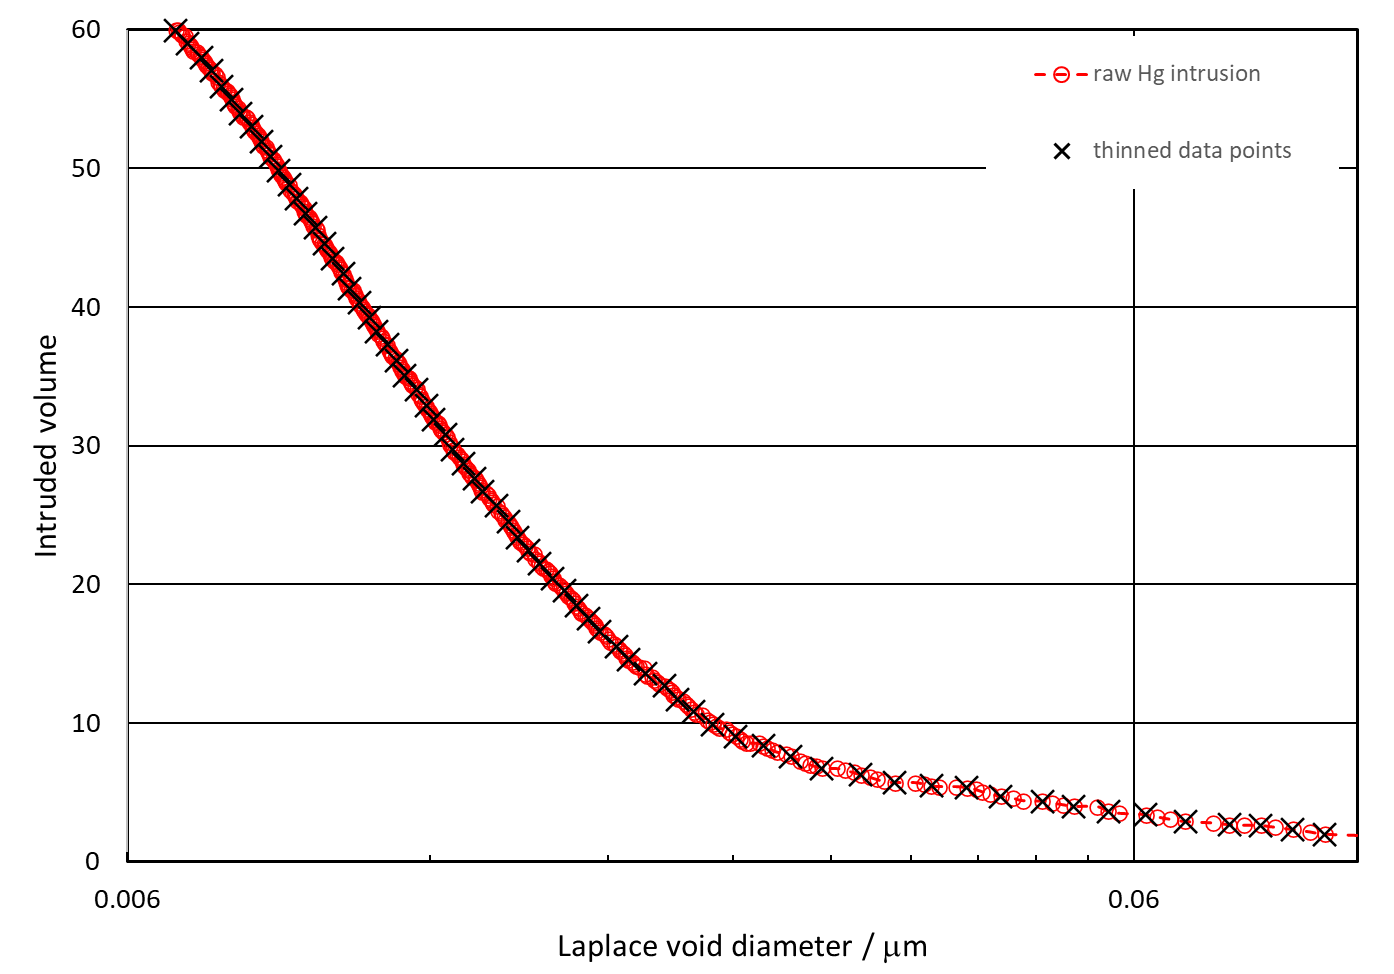
If you have not already done so, download PoreXY from the PoreXpert website free of charge via its user pages. Not only does PoreXY check your data, it also allows trimming, as described in the previous section. It then thins the data by selecting points around 1% or more apart along the percolation curve in two-dimensional parameter space defined by scaling the both the logarithmic axis and the intrusion range to 100%. A thinning example is shown below - note that the spacing is equal along the curve itself, so the steeper part of the intrusion curve is more closely spaced with respect to the logarithmic diameter axis.
For the purposes of this tutorial, use PoreXY to thin the data in the Medicinal tablet datafile as modified in the previous section. Use the dropdown menu after thinning to confirm that PoreXY has thinned the points to give a smaller range of spacing as measured along the intrusion curve itself.
Save your datafile ready for the next part of the tutorial, on how to find the optimum structure type.