A validation was published by Matthews, Canonville and Moss in 2006, using Pore-Cor to check void size distributions against experimental measurements on a range of sandstone and quartz rock specimens, as detailed in Table 1 from that publication.
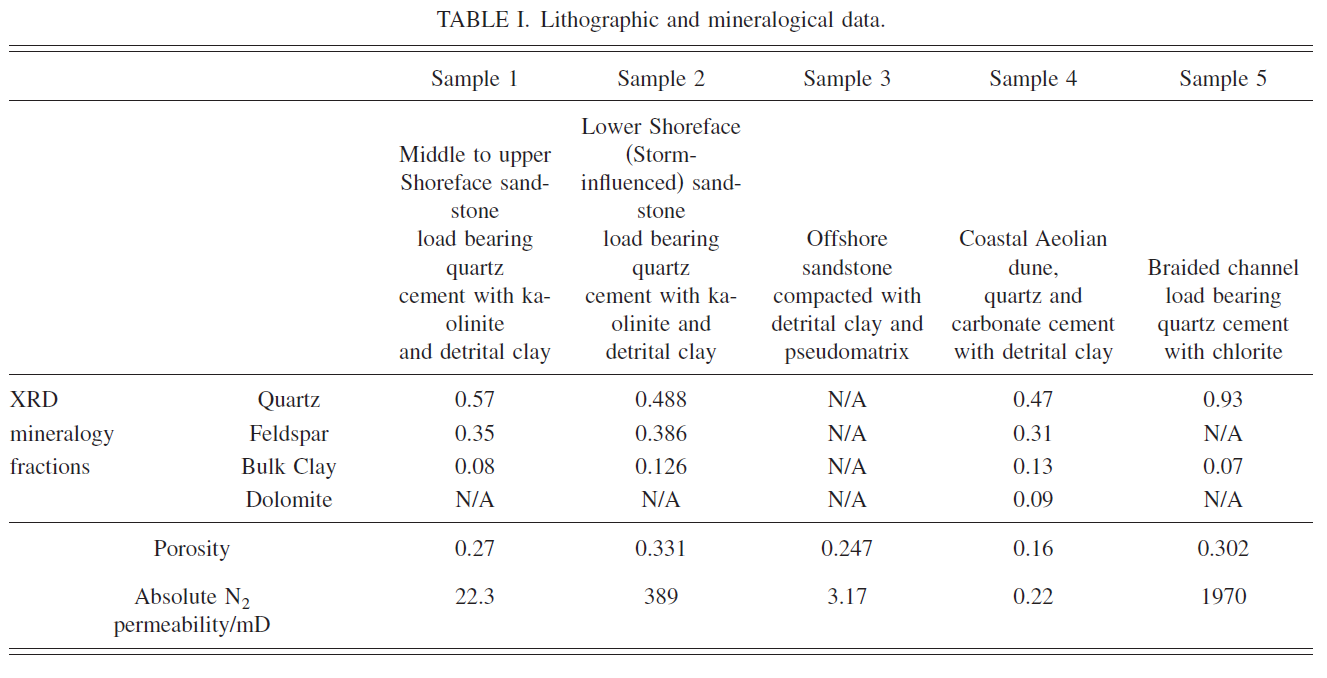
At that time, we measured mercury intrusion characteristics for the sample, as shown below.
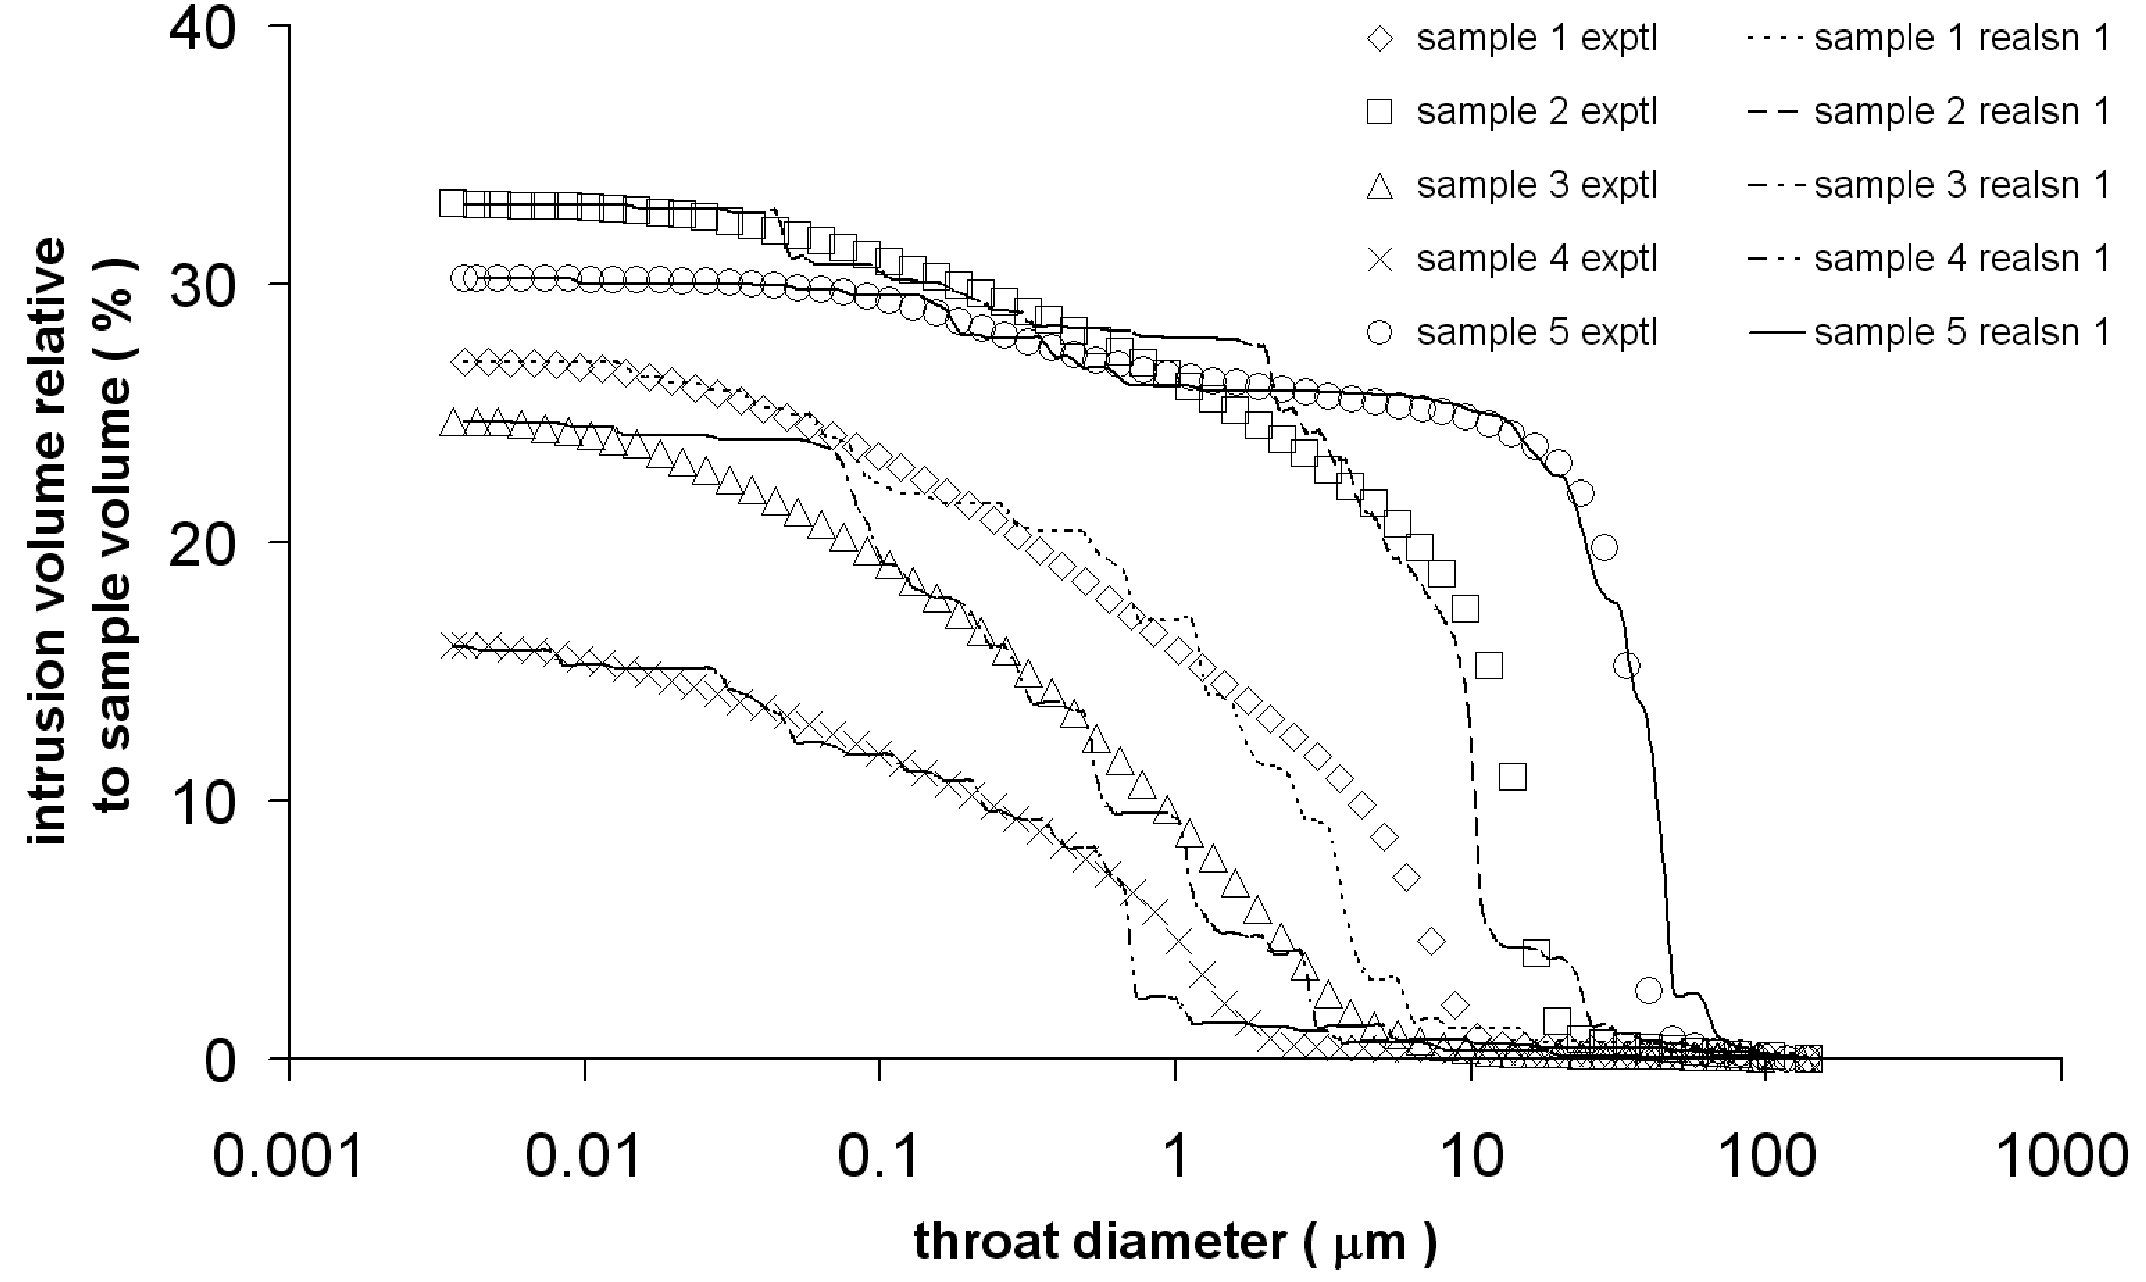
During the 2020 coronavirus 1st-wave lockdown, we used PoreXpert v2 to model the same mercury intrusion curves as shown in the graph above, with the same maximum and minimum void sizes and porosities as quoted in that publication. However, close inspection of the plots above shows that there are not many experimental points around the important points of inflexion of the curves, but plenty at either end. PoreXpert carries out a point by point calculation of Distance, so the fit would be unduly biased towards the maximum and minimum intrusion, and away from the point of inflexion. We therefore thinned the data to eliminate some of the point near the maximum and minimum applied pressures, and correspondingly near the minimum and maximum throat diameters shown on the graph.
Vertically banded structures provided the best fit, as exemplified by the batch result screen below:
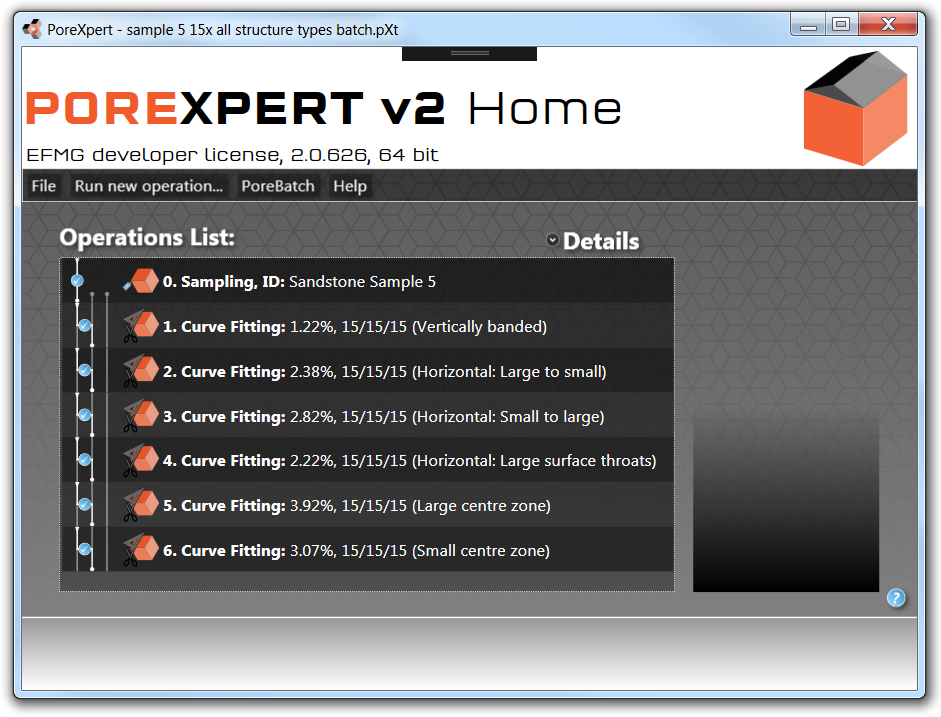
Consequently, all the mercury intrusion curves shown above were fitted with 25x25x25 vertically banded unit cells, fitting the 30 stochastic realisations shown below with an average Distance of 1.3 %.
The next figure shows a comparison between experimental pore areas from image-analysed electron micrographs of microtomed sections of sample 5 (X). Also shown are five Pore-Cor microtome simulations, derived from five stochastic realisations of fits to the mercury intrusion curve. It can be seen that Pore-Cor is much closer to experiment than the capillary bundle model (Δ) which is many orders of magnitude too low. Also superimposed, as red diamonds, are the PoreXpert microtome simulations for the first stochastic realisation fit to the same sample, which are a close fit to experiment. However, it can also be seen that there is a spike in the simulation results at the highest size. It is this spike that the cluster analysis has removed, but the microtoming simulation does not yet take into account the clusters. The cluster analysis has the effect of spreading the spike proportionally down though the rest of the void size range, so that would produce an even closer fit to experiment.
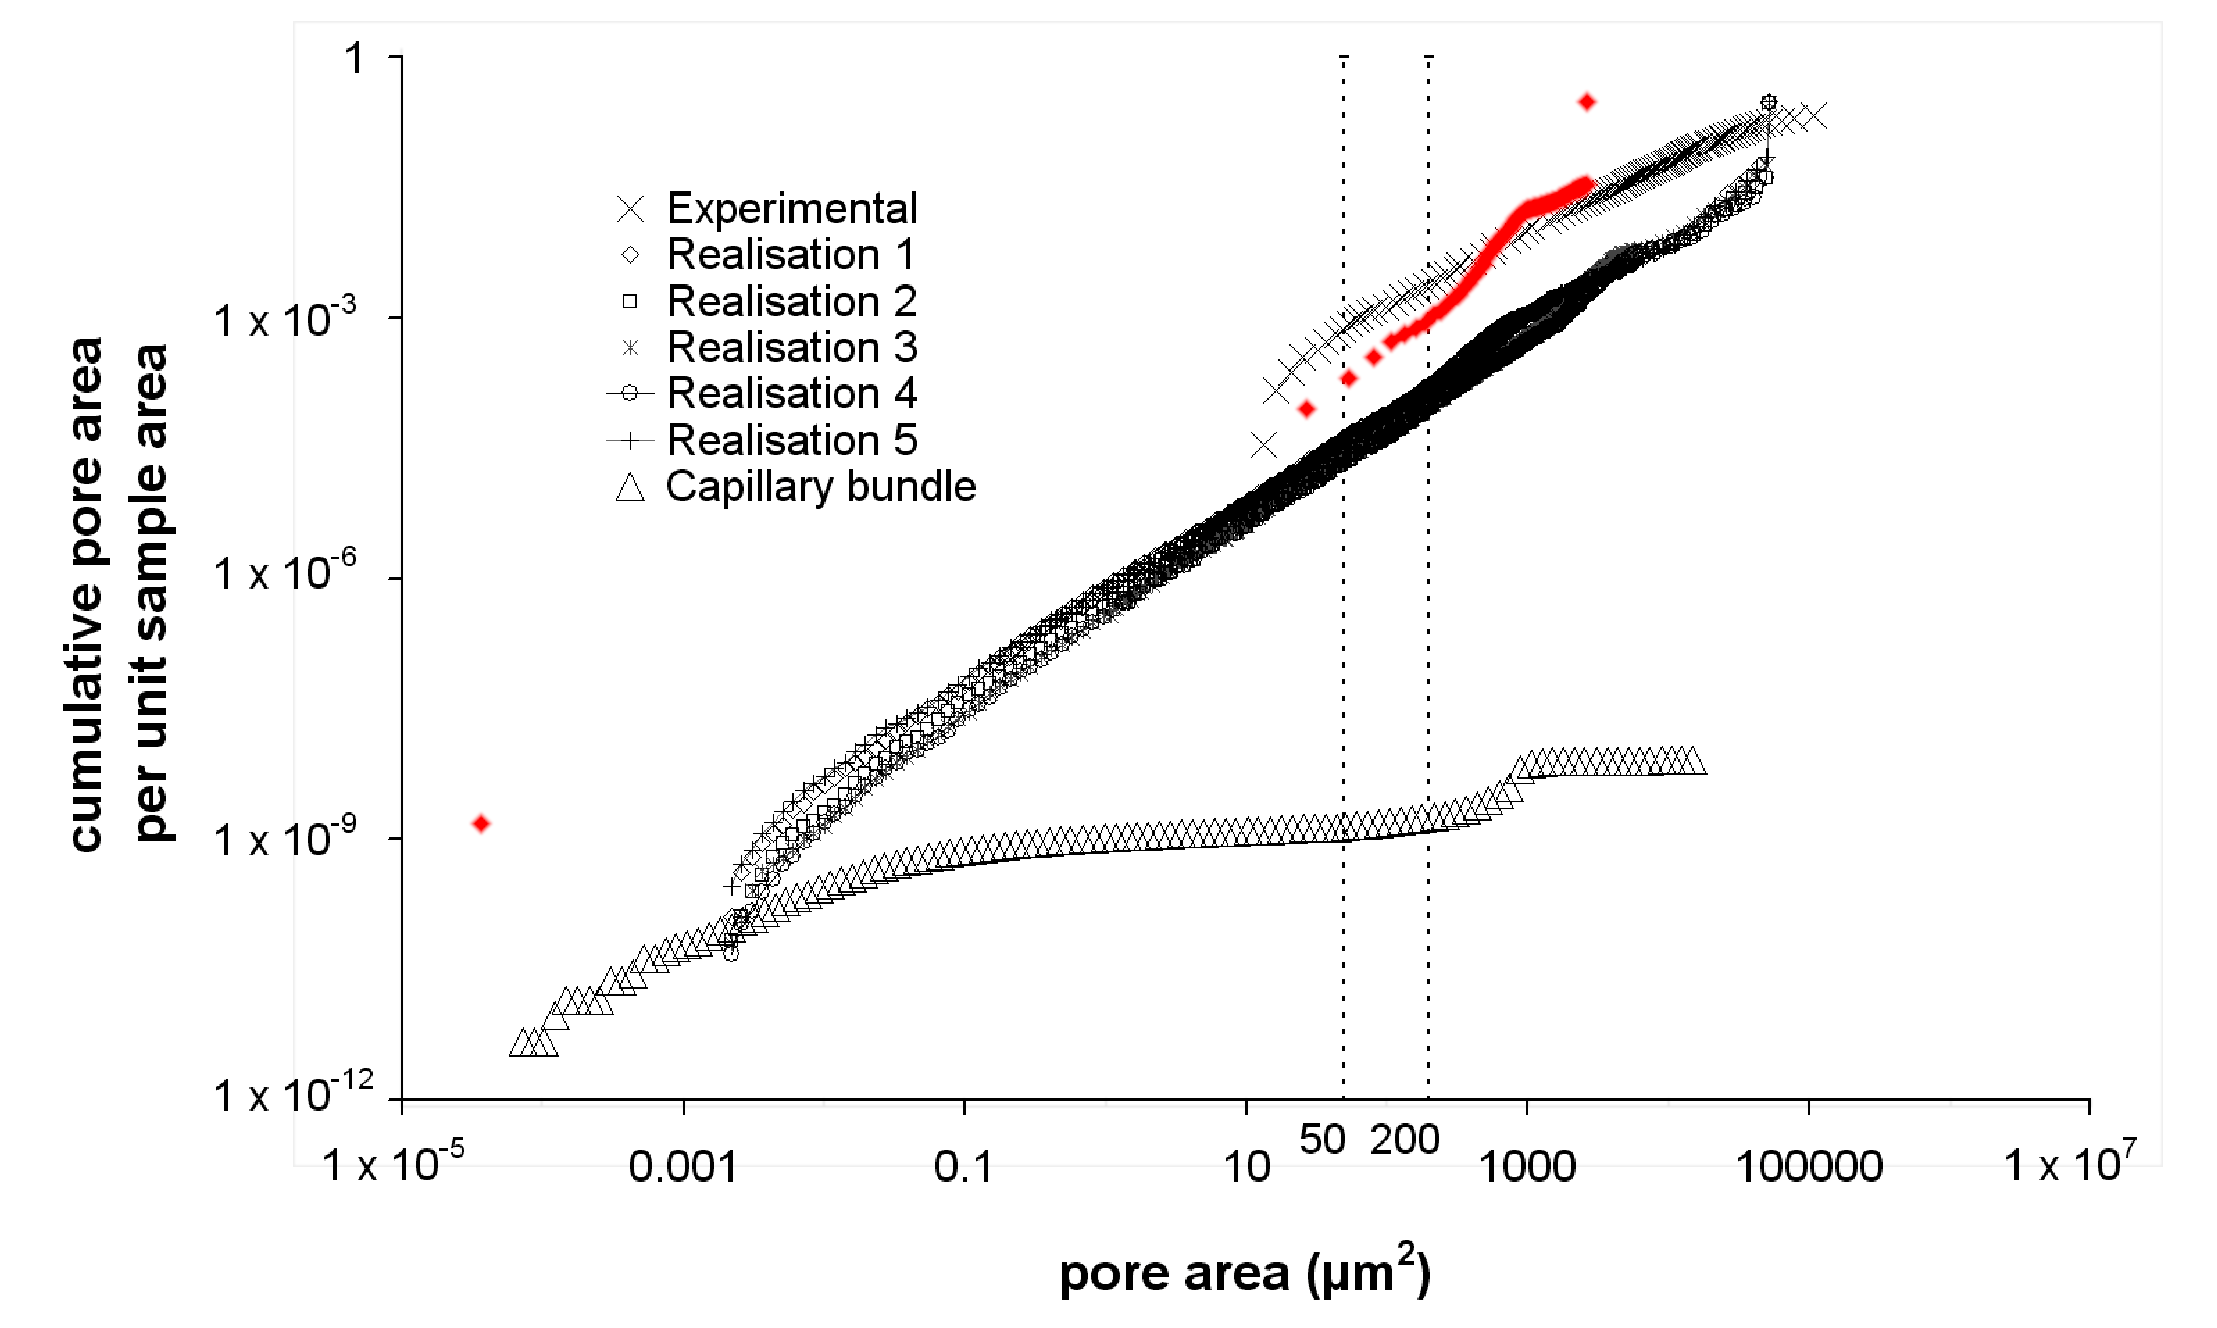
Comparison of microtome simulations by Pore-Cor (black) and PoreXpert (red) with experimental measurements and the capillary bundle model
In the same 2006 publication, we compared experimental and simulated absolute permeabilities using Pore-Cor Research Suite. Figure 7 in that publication, reproduced below, showed that the Pore-Cor permeabilities followed the same trend as experimental samples, but in absolute terms were usually one or more orders of magnitude too low. Hence the fact that we refer to the PoreXpert permeability simulations as network permeabilities. The Thomson and Kozeny equations are both based on semi-empirical fits to experimental data, so do not form a fair comparison with a priori simulations such as ours. Note that there is no one-to-one vertical axis comparison between stochastic generations and no trends between adjacent results - spreading them horizontally is simply a way of showing their general location on the permeability axis and their spread on that axis.
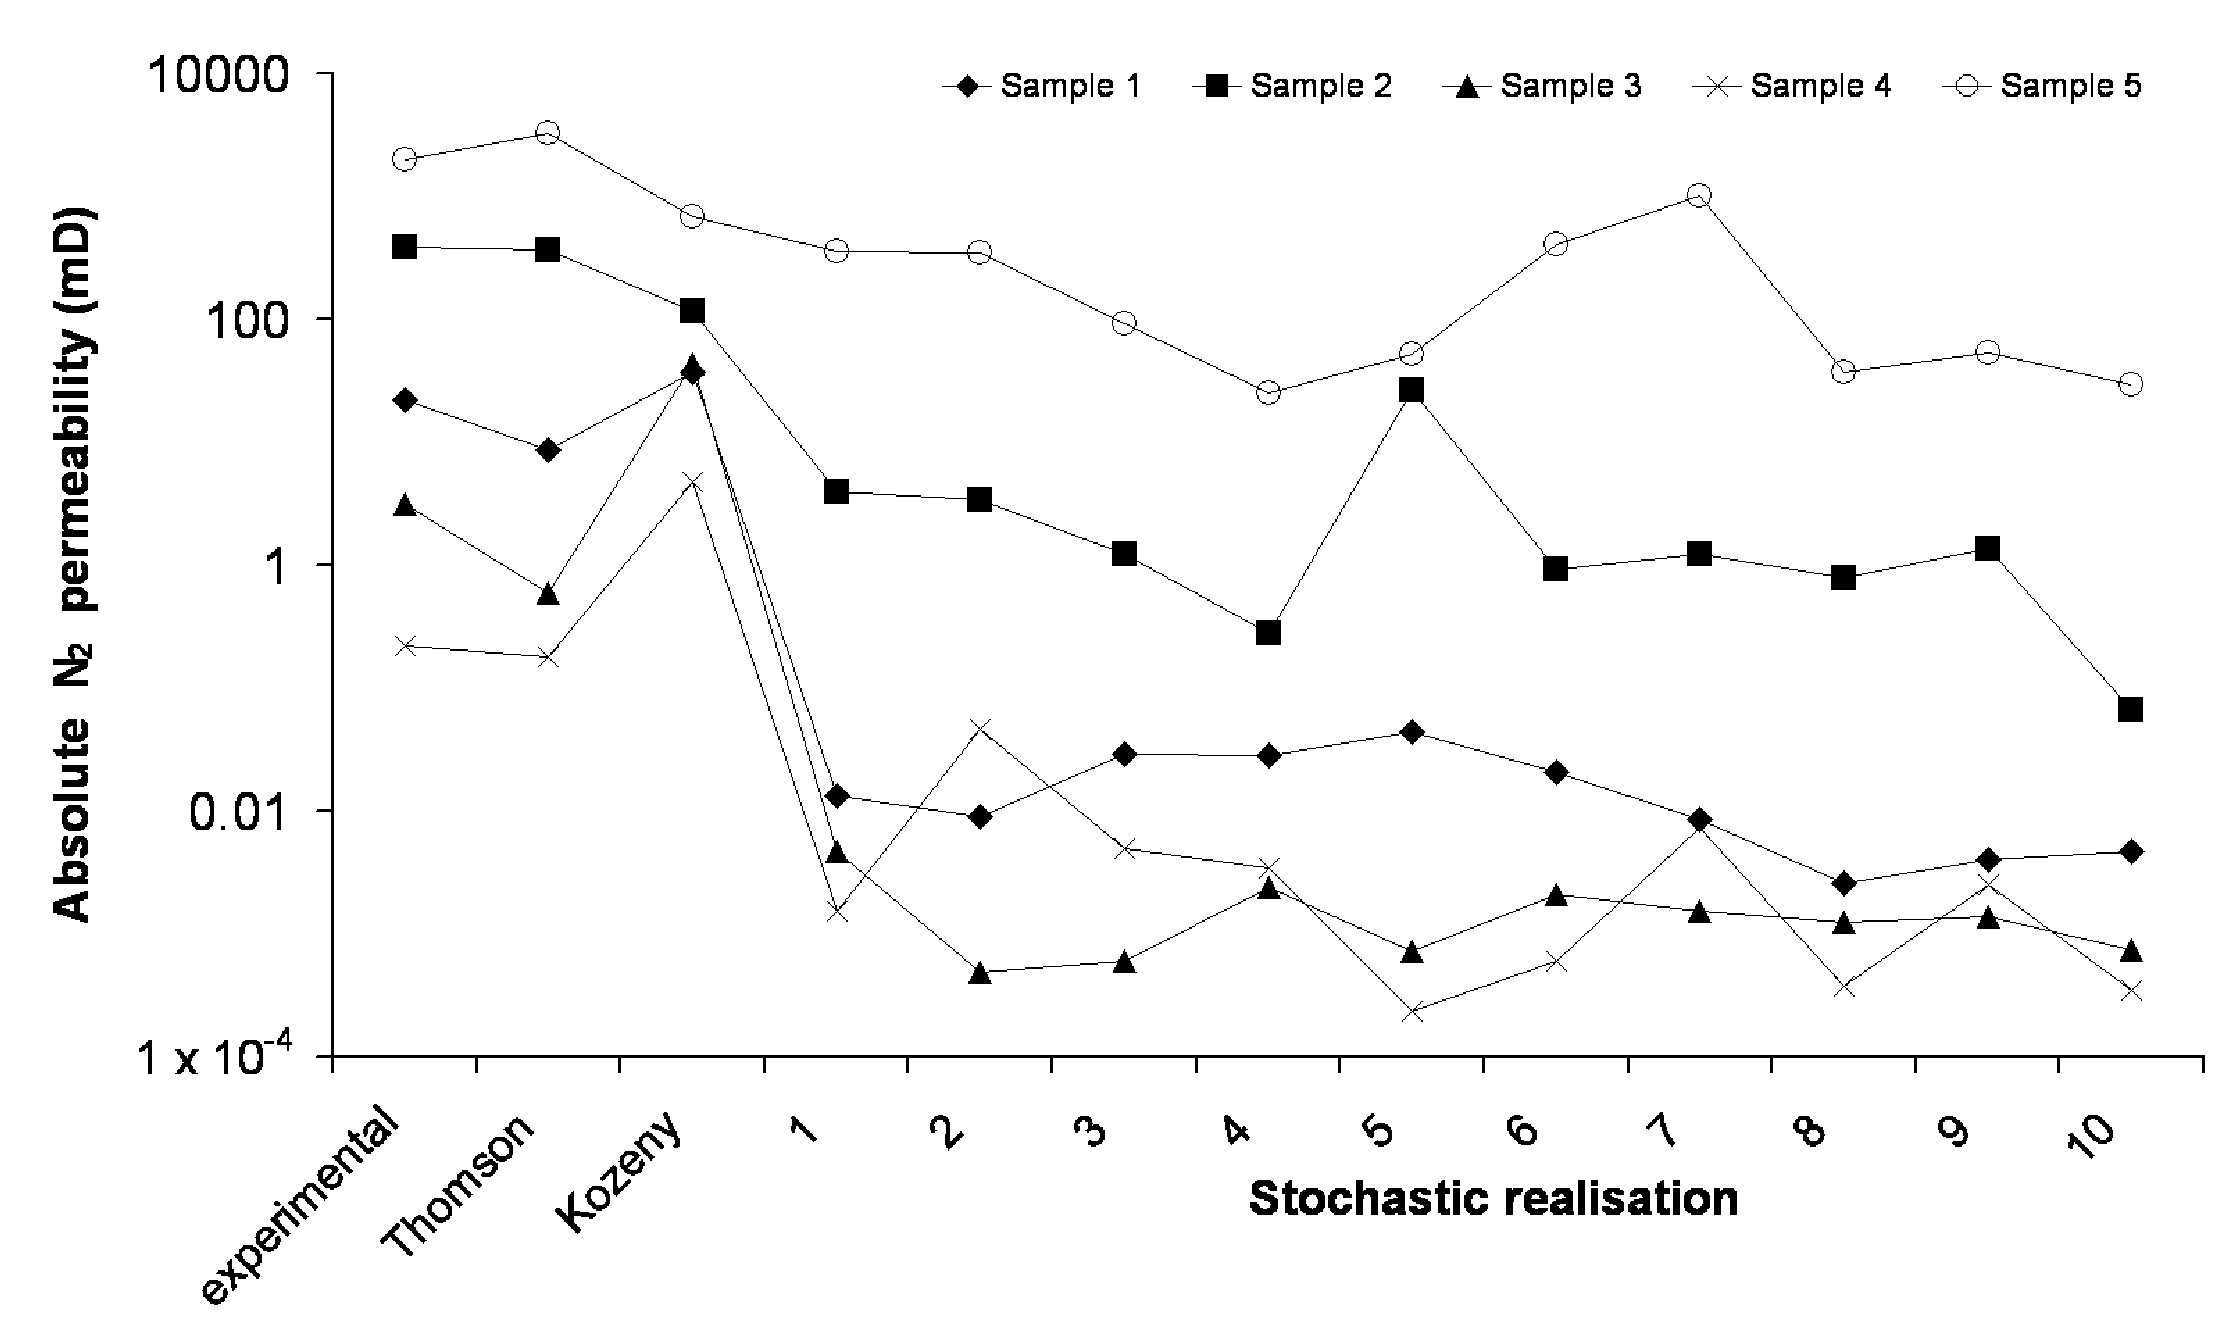
Pore-Cor permeability simulations compared with semi-empirical and experimental values
In the 2020 study, we simulated the permeability for N2 under identical conditions (i.e. a mean free path of 0.069 μm) giving rise to the identical Klinkenberg correction, using PoreXpert v2 Cloud. Our results are shown below. As can be seen, the trend in permeabilities again follow the experimental trend, but are even more exaggerated.
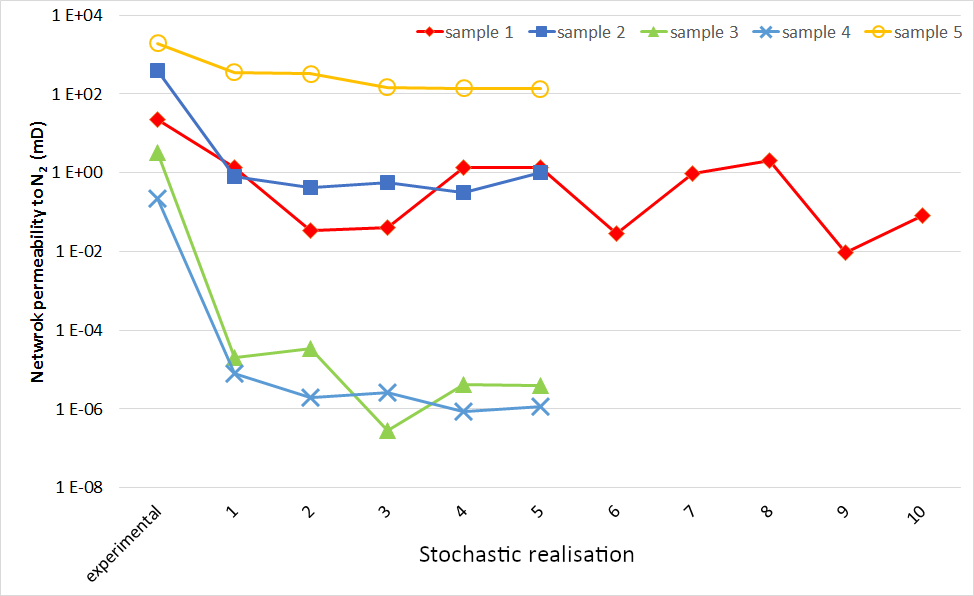
PoreXpert permeability simulations compared with experimental values
What is clear is that PoreXpert is true unto itself, in that the simulated permeabilities track according to the mercury intrusion curves shown above. Compare, for example, sample 3 and 4, which have 50% mercury intrusion around 0.3 μm, and sample 5 which has 50% intrusion around 40 μm; there are two orders of magnitude difference between the intrusion characteristics of the sample, as well as a porosity difference. The PoreXpert flow capacities at these dimensions are dictated by Poiseuillian flow through throats, and vary to the fourth power of the throat radii. So we would expect the permeabilities between samples 3 and 4, and sample 5, to vary by around 8 orders of magnitude, which indeed they do. So the question is: why don't the experimental permeabilities track with the experimental mercury intrusion curves? An obvious answer would be that the permeabilities were measured on larger samples than the 1 cm3 samples used for mercury porosimetry, and that those larger samples included cracks and void features not probed by the porosimetry. However, we have no provenance for the permeability measurements - the values came from a database, so the reason for the discrepancy remains unanswered.
Overall, this updated exercise emphasises that PoreXpert is free of hidden calibration factors - the results depend on basic physics. So, as stated at the outset, it is likely that you will need to calibrate PoreXpert simulations against experimental values for some of your own samples if they are available. That does not reduce the value of PoreXpert - its strength is in trends and what-if experiments. |
 |