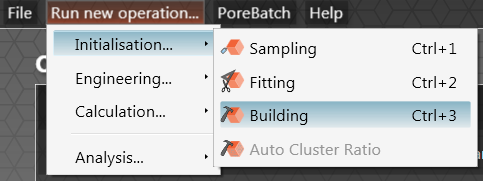
Having fitted the experimental curve, click on Run new operation...| Initialisation ... | Building, or shortcut (CTRL + 3):
Then click Accept in the Unit Cell Building screen:
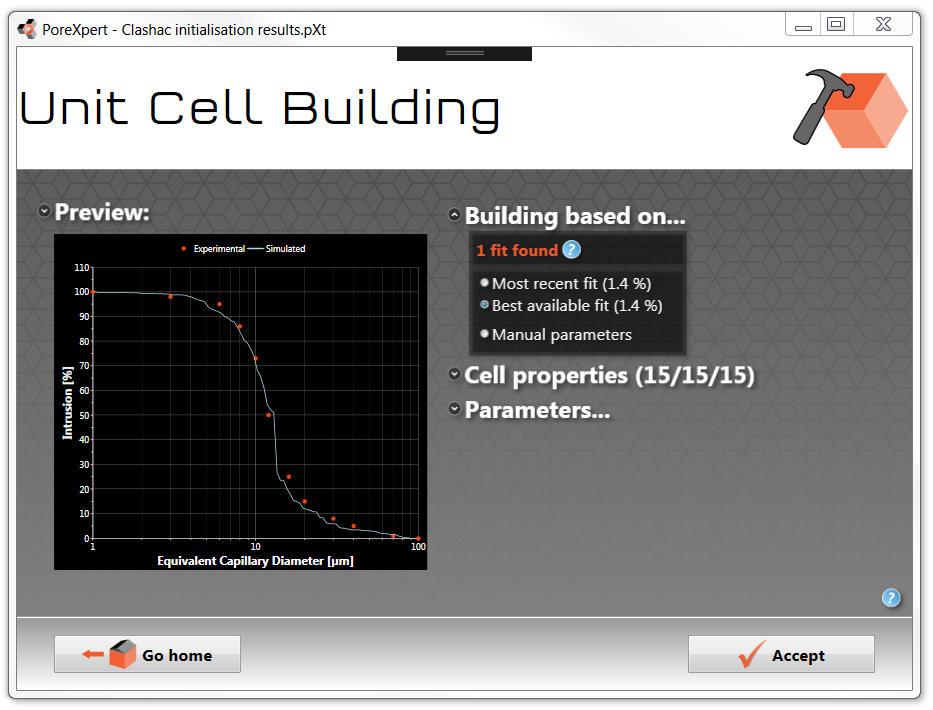
The building screen shows the fit that will be used when creating the unit cell. The fitting parameters can be found in the parameters sub menu, or you can view them by exporting the simulation in PDF or CSV format. The parameters sub menu also allows you to change the solid phase material by selecting a different material in the materials database.
If you click on any operation in the operation list on the home screen and expand the details section on the right hand side of the screen you will see some key details about the operation.

Unit cell viewing
Double click on the Unit Cell Building operation and this will activate the unit cell viewing systems. You get a choice of the 3D cell inspector, 2D cell inspector and a full screen 3D viewer. The following figures show typical outputs. The calculation tutorials will explain the unit cell inspectors in more detail and some of the more advanced functions.
2D cell inspector

Clashac 2D cell inspector showing a layer by layer view of the unit cell with pores and throats shown in black.
3D cell inspector

3D properties view cell inspector operating in x-ray mode highlighting one layer of a Clashac outcrop sandstone unit cell.
Full screen 3D viewer
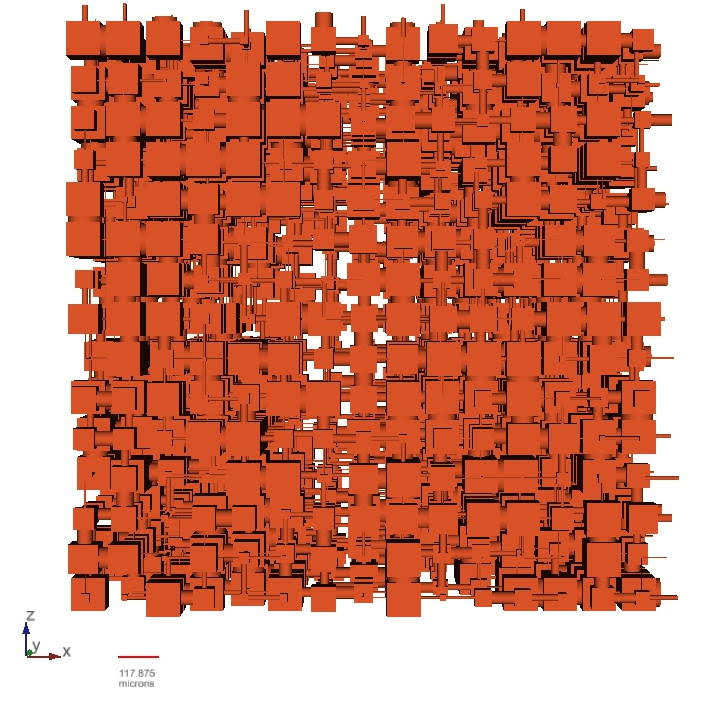
Clashac full screen viewer unit cell captured using screen capture facility built into full screen 3D viewer by pressing "c" on the keyboard. The output is saved as externalCellView.poreXpert.. .jpg in your PoreXpert directory.
Reporting and saving files
To save files or export the operations in a PDF format or spread sheet format, open the file menu and click on Save as. This provides you with a choice of three options: Save as PoreXpert file, CSV or PDF. The PoreXpert file allows you to reopen the file and continue adding additional operations. The PDF reporting and CSV reporting generate a PDF report summarising the operations list, and the CSV report creates a spreadsheet for each operation in the operation list to allow users of the software to combine graphs from different samples.
Please note that generation of PDF reports takes time, as the software needs to plot graphs and create unit cells.
Save the data in all three formats so you can see the outputs from the reporting operations and this concludes the initialisation tutorial.
Now continue with the following Auto cluster ratio tutorial.